

Market Update
Changes to Asset Allocation in Client Portfolios
(3 min read)
16th October 2026
-
Equity markets have delivered strong returns in recent years, supported by resilient economic growth, robust corporate earnings and enthusiasm surrounding AI. However, rising government bond yields now offer investors attractive returns, providing a compelling alternative to equities for the first time in many years. While we remain optimistic about the outlook for stock markets, we have reduced equity exposure in client portfolios in favour of government bonds and alternative investments, taking advantage of opportunities to diversify further and balance risk.
In recent years we have tried to explain why being overweight equity markets, both the UK and Global, made rational sense against a backdrop of sometimes depressing headline news. Markets and investors have had to deal with the unpredictable rhetoric and errors made by policy makers across the political, fiscal, and monetary landscape. The argument has been that the global economy has remained resilient, supported by government spending and loose monetary policy.
While higher inflation has helped to support corporate profits, it has put pressure on bond markets, as yields have risen to reflect the changing economic environment. Bond prices move inversely to yields, meaning that as yields rise, bond prices fall. There have also been themes such as AI driving corporate productivity and earnings growth supporting historically high equity valuations.
Before the ‘normalisation’ of interest rates from zero to around 4% which started in 2022, the optimism for ‘risk’ assets was explained by TINA: There Is No Alternative, in an environment of very low interest rates. Although with some volatility, investors have enjoyed good returns from equity markets and certainly relative to other asset classes.
Chart 1 illustrates the rolling annual return of US equities relative to US government bonds. It demonstrates that the recent outperformance of equities has not been this pronounced since the 1960’s and three times higher than the long-term average. We are not suggesting that a market rout is around the corner. There is plenty to remain optimistic about: corporate earnings and balance sheets are robust, and inflation is slowly moving back to target.
The point is more that bond yields have risen to a level where there is now competition for capital.
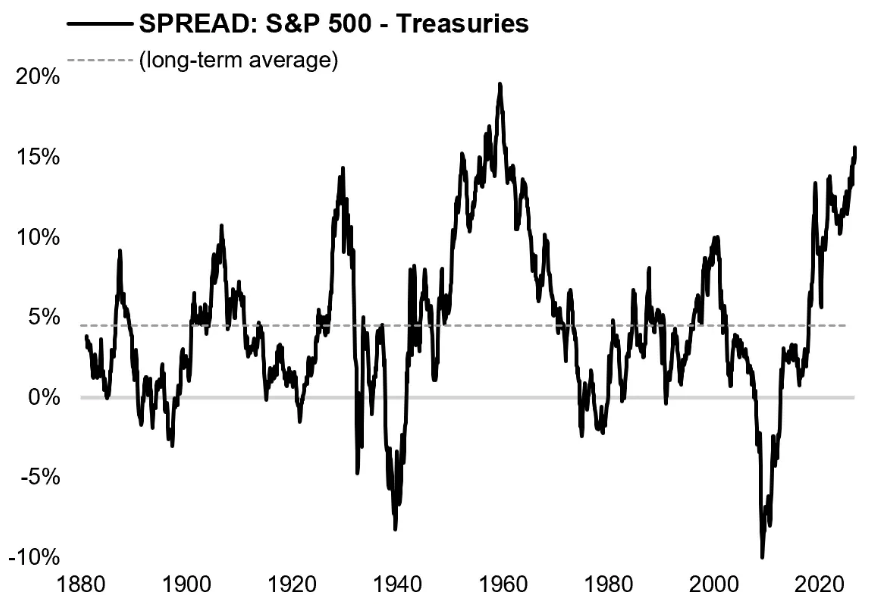
Chart 1
Title: Rolling 10-Year Total Returns: Stocks vs Bonds (1880-2026)
Source: Topdown Charts, LSEG, Robert J Shiller data. www.topdowncharts.com
Chart 2 plots the US 10-year real yield, the return US Treasury bonds offer adjusted for inflation. The average over the last 20 plus years has been about 1%, reaching a high of 3% around the period prior to the Great Financial Crisis (GFC) in 2008 reflecting a period of strong economic growth, to -1% during the GFC and covid recessions. The real yield is now back to that 3% high which is an attractive after-inflation return.
Commentators in the bond market attributed the recent rise in yields to concerns about the risk of higher inflation, which they believe is not fully reflected in market pricing, and a perceived lack of fiscal discipline among governments. However, yields are rising due to competition for capital in a world of mostly strong growth and corporate capital expenditure on projects such as AI. We think this provides an opportunity to diversify portfolios further, not just within the equity markets, but now between asset classes.
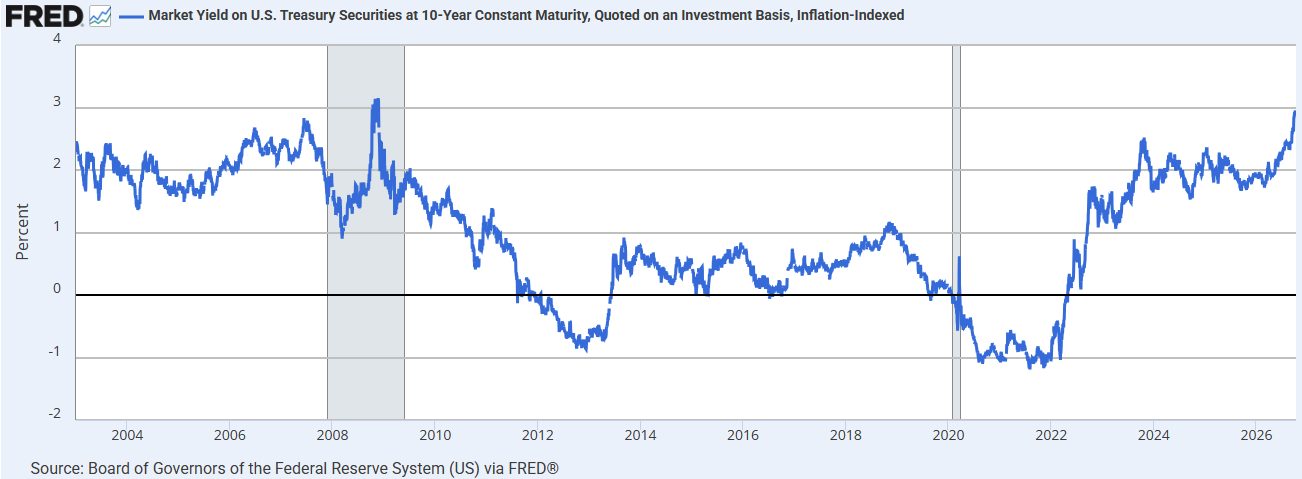
Chart 2
Title: US 10-Year TIPS/Real Yield
Shaded areas indicate U.S. recessions
Source: Board of Governors of the Federal Reserve System (US). fred.stlouisfed.org
Changes to client portfolios
We have been reducing client portfolio weightings to both UK and International equity markets in favour of government bonds and alternative strategies. As alluded to above, we are not anticipating a correction in stock markets but feel it prudent to take advantage of a broader mix of asset classes when the price is right.
Peter Geikie-Cobb | Head of Investment Research
Montgomery Associates
Note: lead image pie chart is illustrative and does not reflect exact asset allocation weightings.
Further Reading
Last month’s article: September 2026 - “The BoE Remains on Hold, for Now”
Services
Compare our four services - from straightforward investment-only portfolios, to our comprehensive Bespoke Service and Family Office.
Glossary
Succinct definitions of financial terms on our Glossary page.
Finance calculators
Compound interest, future income, savings goals, mortgage repayments and school fees. See how a few pounds saved each month could snowball into a substantial nest egg. Try our Finance Calculators.
Risk warning
This article and other articles on www.MontgomeryAssociates.co.uk does not constitute an offer or invitation in respect of investments described, nor should it be interpreted as advice or a recommendation. You should contact your financial adviser or accountant for advice relating to your circumstances. The opinions and information in this article have been prepared from sources believed to be reliable at the time and are given in good faith. The information and opinions expressed in this document represent our views at the time of preparation and may be subject to change. The value of an investment and any income from it can fall as well as rise and you may not get back the amount you originally invested.
Past performance is not a guide to future performance.
Read more Articles